 DACP
Monitoring and dashboard configuration
Monitor nodes, Union, S3 and task data transfers through the internal read-only dashboards. For logical/physical plans and attempts of a particular Job, use the Job dashboard guide.
Node and Union monitoring
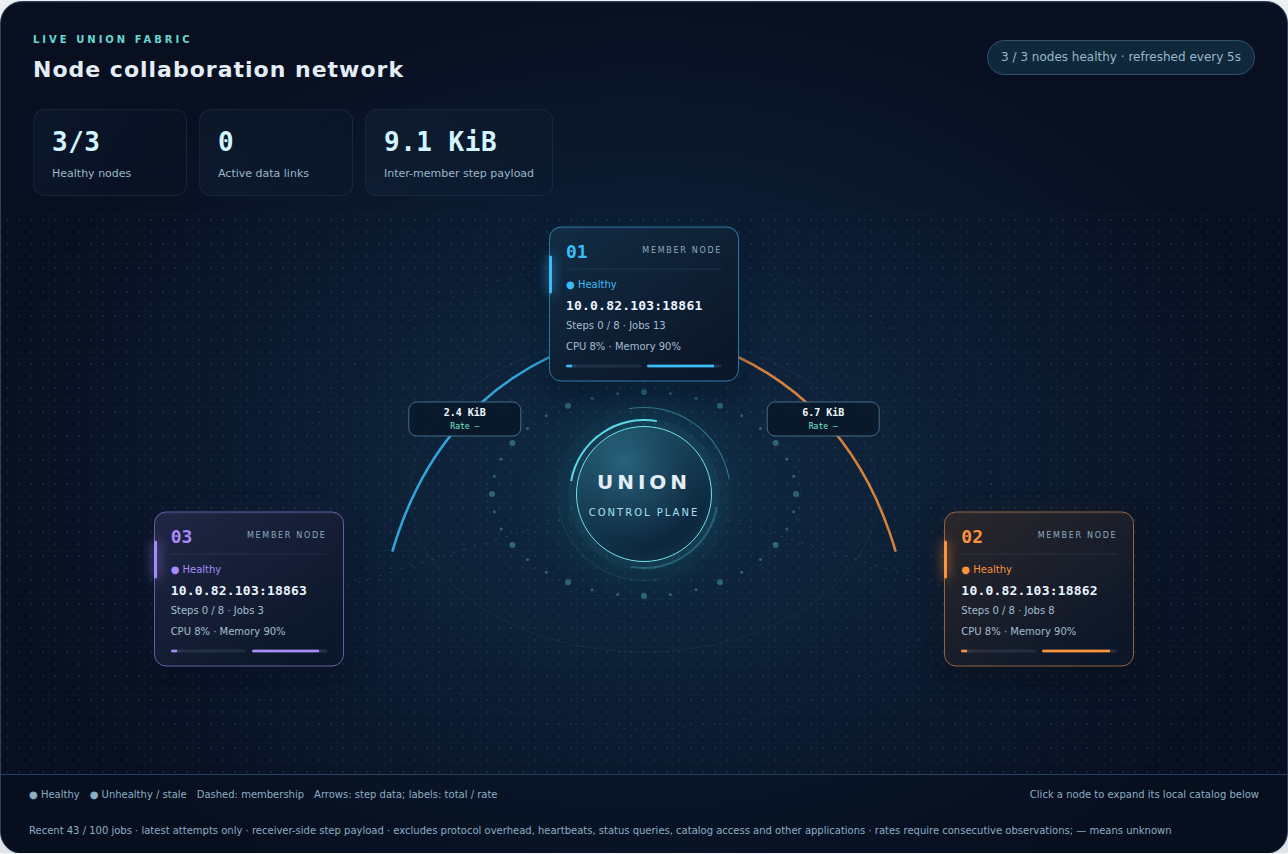
The node overview shows resources, execution capacity and Job status. Union members show health, participation and task stream traffic. Links display cumulative bytes and transfer rates. Retained observations for unavailable members describe the last observation, not current state. Viewing monitoring pages does not read Item data.
S3 operations overview
/s3 shows listener and aggregate counters without bucket browsing, object downloads or account controls. Counter scope and reset behavior are described in S3 monitoring.
Configure the node dashboard
Each node starts HTTP on its DACP service port plus 1000 by default. Startup logs report the actual address. Set an explicit port when the default would exceed 65535:
web:
  enabled: true
  host: 0.0.0.0
  public_host: node-a.example.org
  port: 19861
enabled is boolean; port is 0–65535, with 0 selecting an ephemeral port available as server.webPort. public_host is the browser-facing host and defaults to the node's public_host; the bind address is independent. Disable with web: {enabled: false}. Closing the node closes HTTP; bind failure fails startup and releases acquired resources.
Successful startup advertises web_enabled and web_url through node status so Union can link to the node dashboard. The interface is English; Dataset names, descriptions, step labels and scripts retain their original content. Static resources are available locally.
Dashboards expose execution metadata and stored parameters across submitters. Bind them to the intended internal network. Data and execution authorization remains enforced by DACP service calls. For Union dashboard configuration, see the Union manual.
Diagnose a failed Union Job
The submitting client can read a structured failure from Job status. It contains a safe message, code, phase (preparation, execution or commit), correlation fields request_id and execution_id, and, when known, step_id, operator and node. Failed attempts retain their own failure summary. Missing operators are reported as OPERATOR_NOT_FOUND with the operator reference. Result-stream cancellation is a transport symptom; clients should query Job status for the failure before presenting that symptom as the cause.
The first recorded failure is retained during cancellation and cleanup. Explicit user cancellation remains cancellation. Public diagnostics exclude arbitrary exception text, filesystem paths, credentials and stack traces. For other failures, use the request and execution IDs to locate the full exception stack in server logs. Job ownership checks also apply to failure status.